Longevity Daily Mon · Jun 1

When you sleep predicts how you age more than how long you sleep. That is not the advice most people get.

A 2024 cohort study put a number on it. The most regular sleepers had 48 percent lower all-cause mortality over the follow-up window than the least regular sleepers. Same duration, different schedule, different outcome. The thing being measured was not hours. It was consistency.

Find your sleep window in seven days → the Sleep Window Worksheet.

That worksheet is the seven-day exercise the rest of this email points to. The number it produces is your sleep-regularity baseline. The exercise itself is the intervention.

Not how long, when. Sleep regularity predicts mortality more than duration. 48 percent lower all-cause mortality at the most regular sleep timing. 7 days of accelerometer data to compute Sleep Regularity Index. Plus or minus 30 minutes is the window tolerance that counts as regular, six of seven nights.
Save this. Send it to one person who needs to hear the regularity case.

The Evidence

The metric is called the Sleep Regularity Index. It was introduced in a 2017 Harvard paper by Phillips and colleagues, who tracked 61 undergraduates over thirty days and gave each one an SRI score from 0 to 100. Higher scores meant more consistent bedtimes and wake times. The students with higher SRI scores had measurably better grades. The students with lower SRI scores had circadian rhythms shifted almost three hours later. The duration of their sleep was roughly the same. The pattern was not.

Phillips's group called the result simply enough. Going to sleep and waking up at approximately the same time is as important as the number of hours one sleeps.

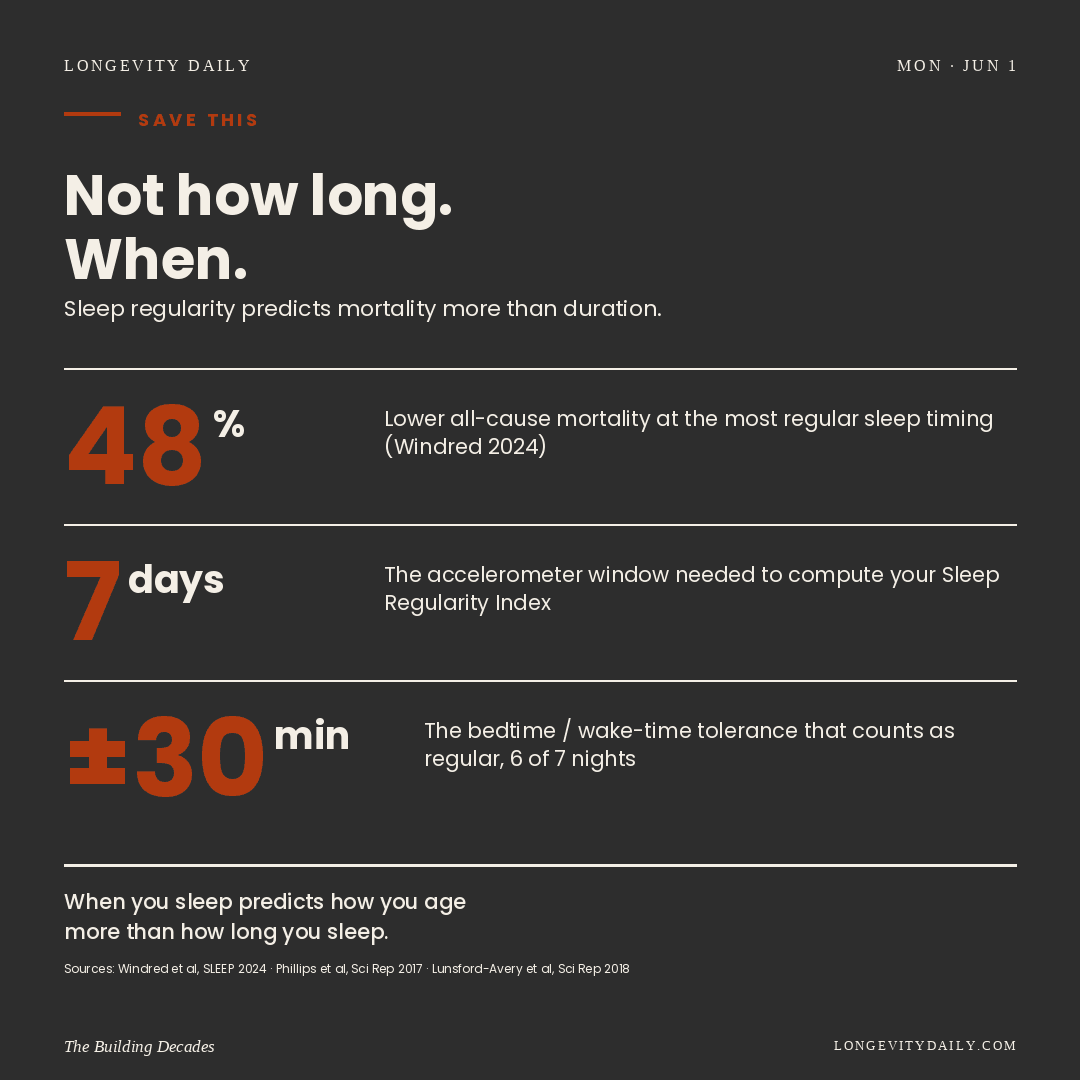
The mortality data arrived in 2024. Windred and colleagues, publishing in SLEEP, took 60,977 UK Biobank adults wearing wrist accelerometers for seven days. They computed an SRI score for each one and followed the cohort for the following years. The people in the top quintile for sleep regularity had about 48 percent lower all-cause mortality than the people in the bottom quintile. The gradient ran cleanly across the four upper quintiles, 20 percent at the third-most-regular, 30 percent at the second, 48 percent at the top. Sleep duration did not explain the effect. SRI did.

The mechanism showed up in an earlier paper. Lunsford-Avery and colleagues, in Scientific Reports in 2018, took 1,978 older adults from the MESA cardiovascular cohort and matched SRI scores to cardiometabolic markers. Higher irregularity correlated with higher ten-year cardiovascular disease risk, higher fasting glucose, higher haemoglobin A1c, higher rates of diabetes and hypertension. The correlation held independent of how long the participants slept. Same hours, more chaos, worse cardiometabolic profile.

This is the bridge between the biological mechanism and the population endpoint. Irregular timing pushes the circadian system out of phase with the metabolic system. Glucose handling drifts. Inflammation drifts. Blood pressure drifts. Repeated nightly over years, those drifts compound. Windred's mortality number is the downstream sum.

Want to find your own number? → the Sleep Window Worksheet.

What This Means For You

Most sleep advice begins with hours. Hit 7 to 9. Wind down for twenty minutes. Avoid screens after 9pm. None of that is wrong. It just optimises the wrong variable.

The variable that predicts mortality at scale is when, not how long. The same six-and-a-half hours hit different metabolic outcomes depending on whether they happen at the same time every night, or scattered between midnight and 3am across the week.

Regular does not mean perfect. The threshold the literature points to is roughly an SRI of 71 or higher. That comes out to about 30 minutes either side of your usual bedtime and wake time, six nights out of seven. Most people who think they have this are wrong. The first time you run the seven-day measurement, you find out where your window actually is. The second week, you hold it.

The hardest hit is usually Friday and Saturday. That is where most adults' SRI scores fall. Two late nights followed by a sleep-in on Sunday morning, and the index drops twenty points. The fix is not stopping the late nights. It is keeping the wake time anchored regardless.

The Action
Find your sleep window. Hold it for seven days. Open the worksheet. Note your natural wake time on a free morning. Subtract the hours you feel best on. That is your bedtime target. Hold it within plus or minus 30 minutes for the next seven nights, including the weekend.
The Sleep Window Worksheet →

Where in your week is your sleep window most likely to slip?


Wednesday Preview

Wednesday's edition takes the falling-asleep-faster problem apart. Sleep hygiene is mostly noise, the caffeine cutoff, the dim room, the white-noise app, all help at the margins. The intervention with the cleanest data is a single temperature move, backed by a 2019 meta-analysis of thirteen trials, that drops sleep onset by about ten minutes. We will show you the study, the time of day, and the temperature.

Until Wednesday.
Longevity Daily · The Building Decades
Share this edition with someone who'd find it useful.

Sources

Windred et al, SLEEP 2024 · Phillips et al, Sci Rep 2017 · Lunsford-Avery et al, Sci Rep 2018

Follow @longevitydaily_  ·  Subscribe

Recommended for you